


Ethereum Shows Cup and Handle Formation, Targets $3,000 Breakout
We have always followed the principles of transparency and clear information. Some of our content includes affiliate links, and we may earn a small commission through these partnerships. These partnerships do not influence our editorial independence or opinion. By using our site, you accept our privacy policy and terms and conditions.


Financial services expert with over three years of experience monitoring cryptocurrency markets and blockchain innovation. Passionate about digital assets and the decentralized future.
Cryptocurrency is a high-risk asset class, and investing carries significant risk, including the potential loss of some or all of your investment. The information on this website is provided for informational and educational purposes only and does not constitute financial, investment, or gambling advice. Cryptowinx does not endorse any specific exchange or gaming platform. For more details, please read our terms and full disclaimer.
Cryptowinx navigates the digital asset universe with a dynamic, forward-looking vision. Throughout our evolution, we have followed every market cycle, from vertical rises to corrections, always remaining a solid point of reference for our community. Our team is made up of industry experts and analysts who experience the blockchain ecosystem daily: we constantly monitor Bitcoin’s stability, study the expansion of the Ethereum ecosystem, and analyze the new frontiers of crypto casinos. We are committed to absolute editorial integrity, separating the signal from the noise through rigorous fact-checking and multi-perspective news analysis. In a landscape where innovations emerge in moments, our mission is to simplify complex concepts and offer transparency into what is established and what is still experimental.
Learn more Cryptowinx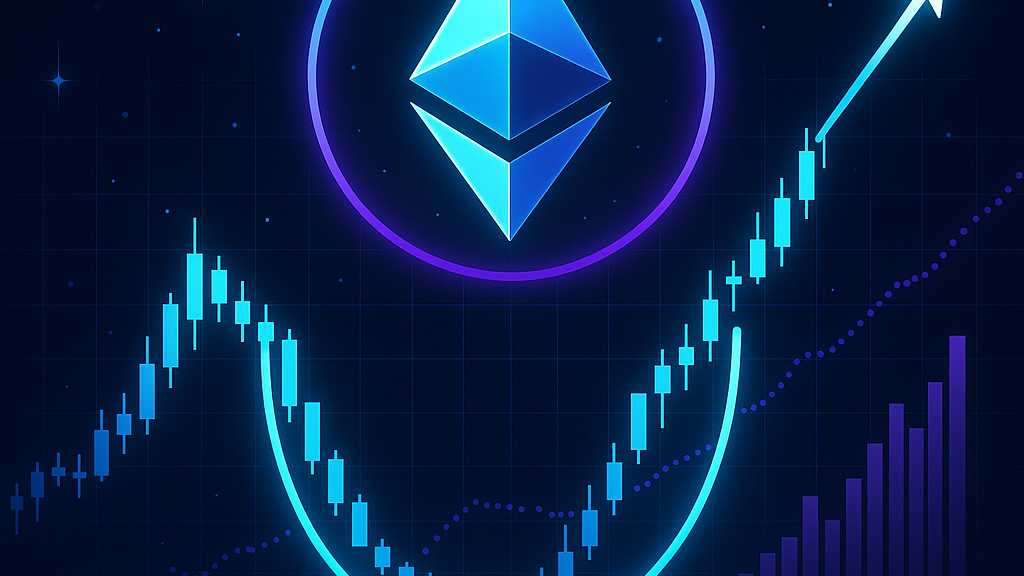
Despite a challenging market landscape, Ethereum’s price chart is showing promising signs of recovery with the emergence of a cup and handle pattern. This technical formation hints at potential upward movement, suggesting a possible run towards the $3,000 mark.
Currently trading at approximately $2,172, Ethereum faces significant pressure, having dropped more than 35% since the start of the year. Various macroeconomic factors, such as geopolitical tensions, inflation fears, and a hawkish Federal Reserve, have contributed to this downturn.
Over the past two months, Ethereum has seen a decline alongside Bitcoin and the broader cryptocurrency market as global conditions have failed to favor riskier assets. Investors have retreated towards traditional safe-haven options, including gold, amid rising geopolitical instability and inflationary concerns.
In recent weeks, however, institutional interest appears to be stabilizing. Data shows that Ethereum exchange-traded funds (ETFs) have attracted $302.8 million in net inflows this month, indicating a potential shift in market sentiment towards recovery.
The cup and handle pattern has been forming on Ethereum’s daily chart since early February, characterized by a rounded bottom that signifies stabilization followed by a slight downturn, which is often viewed as a shakeout for weaker hands. The critical level of resistance lies at $2,400, which represents the neckline of the pattern.
A decisive movement above this threshold could pave the way for Ethereum to target the ambitious $3,000 level, calculated by measuring the height of the cup and projecting it upwards from the breakout point. Nevertheless, current momentum indicators are still skewed towards bearishness, suggesting that selling pressure remains prominent, despite signs of exhaustion.
As of now, the primary resistance to monitor is the $2,400 level, which Ethereum was unable to surpass during a recent market recovery. Conversely, the $2,000 support level is crucial for preventing a further decline back towards this year’s lows.
In summary, while Ethereum is experiencing notable resistance and market pressures, the emergence of a cup and handle pattern offers a glimmer of hope for bullish traders. Monitoring the key levels of support and resistance will be essential in the upcoming sessions as the market seeks to navigate these turbulent waters.
Leave the reaction
Gregory Russell


Commentaries
Add your comment
Fill in necessary fields and publish